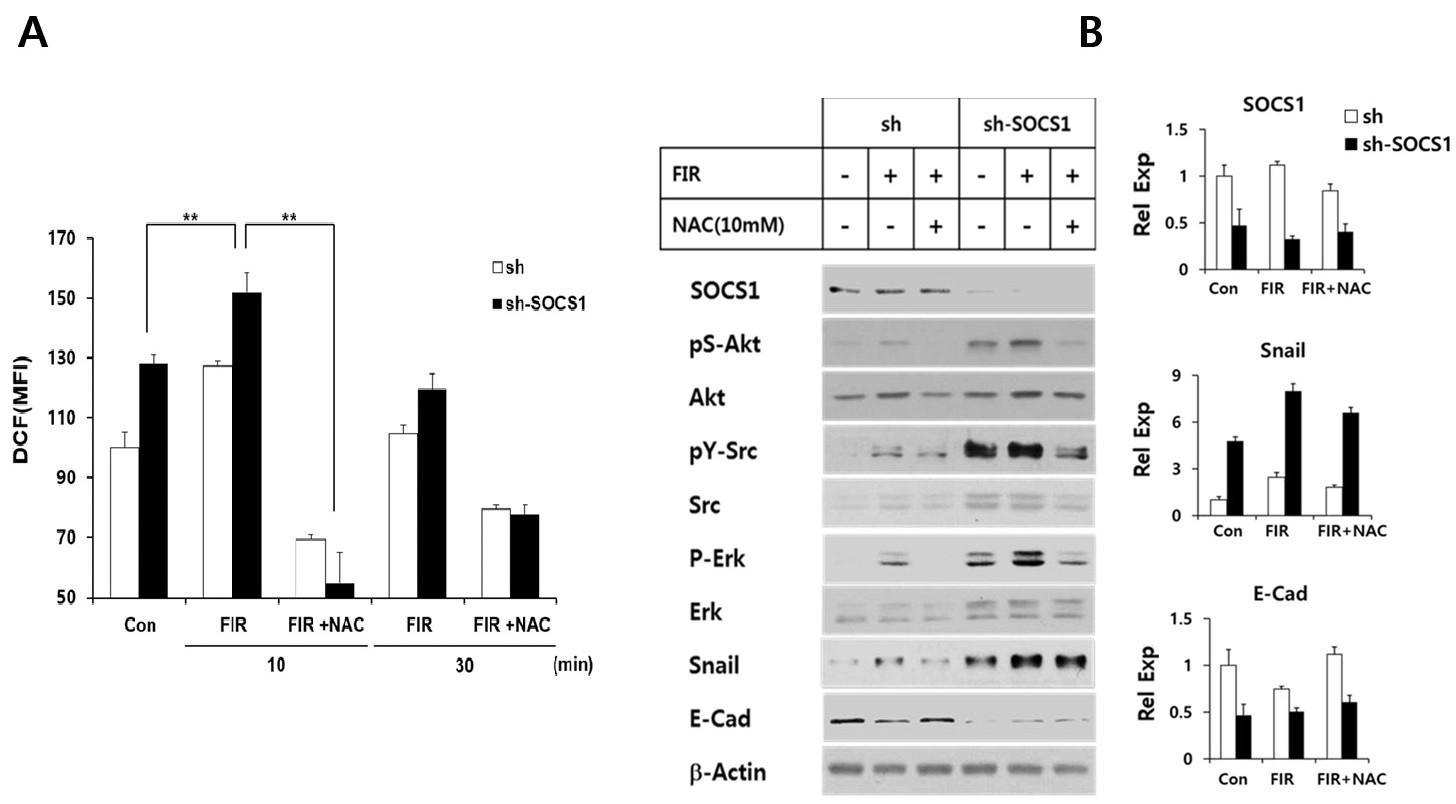
Fig. 4. SOCS1 knock-down promoted ROS levels and the FIR-induced Akt/Src/Erk signaling leading to EMT. (A) HCT116 p53 +/+ cells with sh or shSOCS1 received FIR treatment in the presence and absence of NAC, and ROS levels were analyzed at indicated time points as described. Results show representative data of independent experiments performed in triplicate wells (*, p ≤ 0.05; **, p ≤ 0.01). (B) After receiving FIR, sh or sh-SOCS1 cells were subjected to Western blot to analyze the protein levels of EMT signaling molecules and phenotypic markers. The quantitated relative expression levels for Snail, E-cad and SOCS1 normalized to beta actin were obtained by densitometry analysis.